How to install Nagios and NRPE in Centos 7 or RHEL 7
Index
1. Introduction
Nagios is a powerful monitoring system that enables organizations to identify and resolve IT infrastructure problems before they affect critical business processes.
Nagios runs periodic checks on user-specified resources and services.
Resources that can be monitored include:
Memory usage
Disk usage
Microprocessor load
The number of currently running processes
Log files.
Services that can be monitored include:
Simple Mail Transfer Protocol (SMTP)
Post Office Protocol 3 (POP3)
Hypertext Transfer Protocol (HTTP) and other common network protocols.
A user-friendly Web-based graphical user interface is provided. An authorization system allows the administrator to restrict access as necessary.
2. Features
- Monitor your entire IT infrastructure;
- Identify problems before they occur;
- Know immediately when problems arise;
- Share availability data with stakeholders.hypothetical question;
- Detect security breaches;
- Plan and budget for IT upgrades;
- Reduce downtime and business losses.
3. Prerequisition
Nagios server:
Operating system : CentOS 7
IP Address : 138.201.3.27/32
Nagios client:
Operating System : ubuntu 15.10
IP Address : 138.201.3.28/32
If you have a fresh server you should configure lamp stack on the same.
Also install the following prerequisites too. All commands should be run as root user.
# yum install gd gd-devel gcc glibc glibc-common wget
Nagios user and group
 #useradd -m nagios
 #passwd nagios
Create a new nagcmd group for allowing external commands to be submitted through the web interface. Add both the nagios user and the apache user to the group.
   # groupadd nagcmd
   #usermod -a -G nagcmd nagios
   #usermod -a -G nagcmd apache
4. Download Nagios And Plugins
By using wget utility we can retrieve files for the installation of latest version of Nagios.
For a good practise download the files in to “/usr/local/src”.
#cd /usr/local/src

#wget https://assets.nagios.com/downloads/nagioscore/releases/nagios-4.1.1.tar.gz
Download nagios plugins too. Nagios plugins allow you to monitor hosts, devices, services, protocols, and applications with Nagios.
#wget http://www.nagios-plugins.org/download/nagios-plugins-2.1.1.tar.gz
5. Install Nagios And Plugins
5.1 Install nagios:
Change directory to “/usr/local/src” and extract nagios.
#tar xzf nagios-4.1.1.tar.gz
change to the nagios directory then compile and install.
#cd nagios-4.1.1/
#sudo ./configure --with-command-group=nagcmd
#make all
#make install
#make install-init
#make install-config
#make install-commandmode
5.2 Install Nagios Web interface
Enter the following commands to compile and install nagios web interface.
#make install-webconf
Create a nagiosadmin account for logging into the Nagios web interface. Remember the password you assign to this account. You’ll need it while logging in to nagios web interface..
# sudo htpasswd -c /usr/local/nagios/etc/htpasswd.users nagiosadmin
Restart Apache to make the new settings take effect.
#systemctl restart httpd
5.3 Install Nagios plugins
Go to the directory /usr/local/src where you downloaded the nagios plugins, and extract it.
#cd /usr/local/src
#tar xzf nagios-plugins-2.0.3.tar.gz
After extracting down loaded file change directory to nagios-plugins by using cd commandand compile and install plugins
#cd nagios-plugins-2.0.3
#./configure --with-nagios-user=nagios --with-nagios-group=nagios
#make
#make install
6.Access Nagios Web Interface
Open nagios administrator console with URL http://nagios-server-ip/nagios and enter the username as “nagiosadmin” and its password which we created in the earlier steps.
Now we can see home page of Nagios, there is an option “Hosts”on the left panel ,by clicking on that we can see hosts currently monitoring by the Nagios server.
Here we can see that Host status and details of host.
In left panel there is an option “Services” which shows that the current status of all services of the localhost.
7.Add Monitoring targets to Nagios server
Now nagios server is ready to monitor so, the next step is to add Nagios clients to monitor, Here Ubuntu 15.10 server has been taken as nagios client.
nrpe and nagios-plugins are need to add in our monitoring targets.
#apt-get install nagios-nrpe-server nagios-plugins
7.1 Configure nagios Client
Then add the nagios server IP to which nagios client should be listen.
Edit /etc/nagios/nrpe.cfg file,Add your Nagios server ip address:
# vi /etc/nagios/nrpe.cfg
allowed_hosts=127.0.0.1 138.201.3.27
Start nrpe service on Ubuntu client:
/etc/init.d/nagios-nrpe-server restart
Now, go back to your Nagios server, and add the clients in the configuration file.
open “/usr/local/nagios/etc/nagios.cfg” and uncomment below line:
# vi /usr/local/nagios/etc/nagios.cfg

cfg_dir=/usr/local/nagios/etc/servers
Create a directory called “servers” under “/usr/local/nagios/etc/”.
# mkdir /usr/local/nagios/etc/servers
Create config file to the client to be monitored and make changes as follows
$vi /usr/local/nagios/etc/servers/clients.cfg


define host{
use                             linux-server
host_name                       arunima-ubuntu15
alias                           arunima-ubuntu15
address                         138.201.3.28
max_check_attempts              5
check_period                    24x7
notification_interval           30
notification_period             24x7
}
Here my nagios client ip is “138.201.3.28” and hostname arunima-ubuntu15 .
Then restart nagios server
#systemctl restart nagios
Wait for few seconds, and refresh nagios admin console in the browser and navigate to “Hosts” section in the left pane. You will see the newly added client will be visible there. Click on the host to see if there is anything wrong or any alerts it has.
http://IP-Address/nagios
Define services
We have just defined the monitoring host. Now, let us add some services of the monitoring host. Here i have added ssh, ftp and http services to monitor.
# vi /usr/local/nagios/etc/servers/clients.cfg

define service {
        use                             generic-service
        host_name                       arunima-ubuntu15
        service_description             SSH
        check_command                   check_ssh
        notifications_enabled           0
        }
define service {
        use                             generic-service
        host_name                       arunima-ubuntu15
        service_description             VSFTPD
        check_command                   check_ftp
        notifications_enabled           0
        }
define service {
        use                             generic-service
        host_name                       arunima-ubuntu15
        service_description             HTTPD
        check_command                   check_http
        notifications_enabled           0
        }
Before adding services to monitor make sure that all are currently running in nagios client.
#systemctl restart nagios
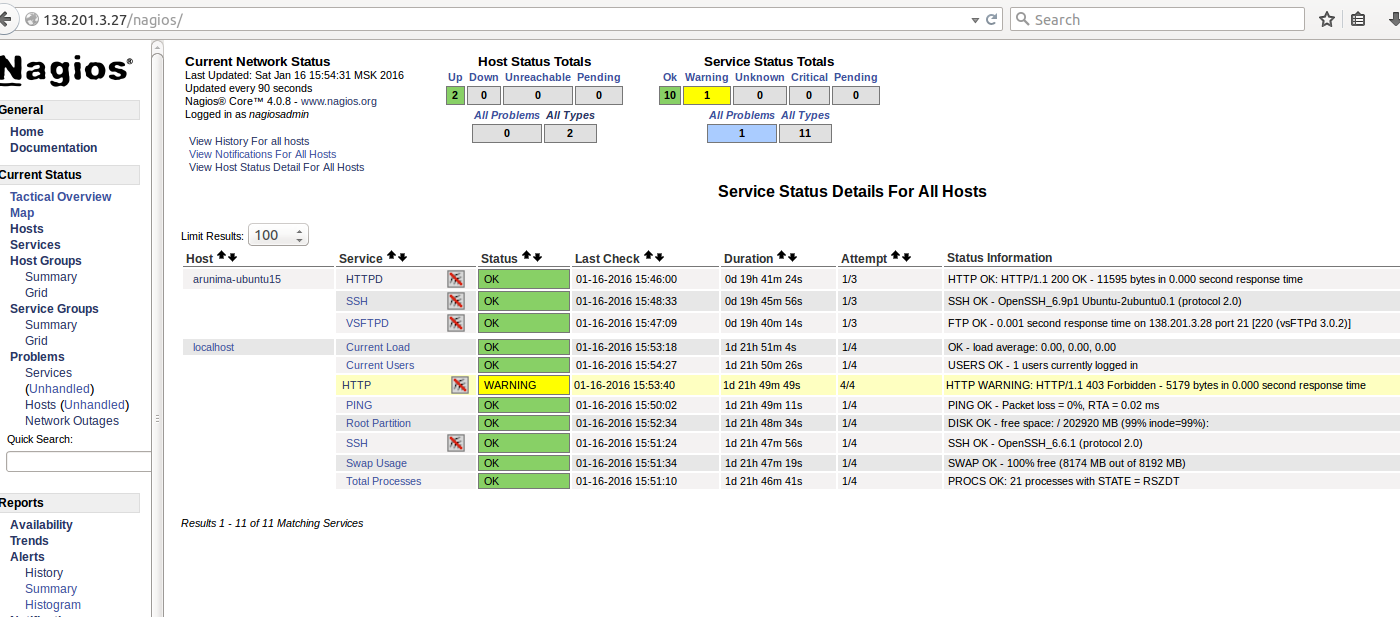
Navigate your browser to http://IP-Address/nagios and enter the Username and Password then click “Hosts”, Here you can see the new linux host and status of services which has been added.
This article is not working..There are some errors while compiling..Pls update it.
Can you give the error logs